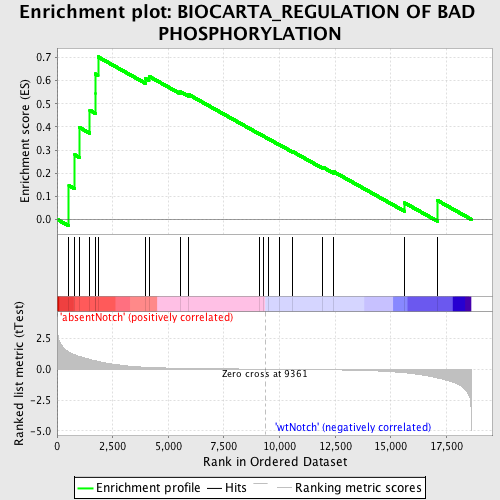
Profile of the Running ES Score & Positions of GeneSet Members on the Rank Ordered List
| Dataset | Set_03_absentNotch_versus_wtNotch.phenotype_absentNotch_versus_wtNotch.cls #absentNotch_versus_wtNotch.phenotype_absentNotch_versus_wtNotch.cls #absentNotch_versus_wtNotch_repos |
| Phenotype | phenotype_absentNotch_versus_wtNotch.cls#absentNotch_versus_wtNotch_repos |
| Upregulated in class | absentNotch |
| GeneSet | BIOCARTA_REGULATION OF BAD PHOSPHORYLATION |
| Enrichment Score (ES) | 0.703231 |
| Normalized Enrichment Score (NES) | 1.5054247 |
| Nominal p-value | 0.024856597 |
| FDR q-value | 0.67570585 |
| FWER p-Value | 1.0 |
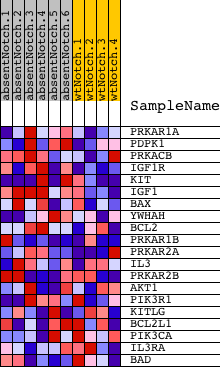
| PROBE | DESCRIPTION (from dataset) | GENE SYMBOL | GENE_TITLE | RANK IN GENE LIST | RANK METRIC SCORE | RUNNING ES | CORE ENRICHMENT | |
|---|---|---|---|---|---|---|---|---|
| 1 | PRKAR1A | 3450369 | 532 | 1.376 | 0.1459 | Yes | ||
| 2 | PDPK1 | 6650168 | 798 | 1.163 | 0.2791 | Yes | ||
| 3 | PRKACB | 4210170 | 995 | 1.021 | 0.3980 | Yes | ||
| 4 | IGF1R | 3360494 | 1474 | 0.786 | 0.4720 | Yes | ||
| 5 | KIT | 7040095 | 1727 | 0.675 | 0.5440 | Yes | ||
| 6 | IGF1 | 1990193 3130377 3290280 | 1730 | 0.674 | 0.6293 | Yes | ||
| 7 | BAX | 3830008 | 1838 | 0.628 | 0.7032 | Yes | ||
| 8 | YWHAH | 1660133 2810053 | 3968 | 0.161 | 0.6092 | No | ||
| 9 | BCL2 | 730132 1570736 2470138 3800044 4810037 5690068 5860504 6650164 | 4131 | 0.146 | 0.6190 | No | ||
| 10 | PRKAR1B | 6130411 | 5550 | 0.072 | 0.5519 | No | ||
| 11 | PRKAR2A | 2340136 | 5916 | 0.061 | 0.5400 | No | ||
| 12 | IL3 | 2480280 | 9083 | 0.004 | 0.3702 | No | ||
| 13 | PRKAR2B | 3130593 5220577 | 9292 | 0.001 | 0.3592 | No | ||
| 14 | AKT1 | 5290746 | 9501 | -0.002 | 0.3482 | No | ||
| 15 | PIK3R1 | 4730671 | 9986 | -0.008 | 0.3233 | No | ||
| 16 | KITLG | 2120047 6220300 | 10593 | -0.018 | 0.2929 | No | ||
| 17 | BCL2L1 | 1580452 4200152 5420484 | 11948 | -0.042 | 0.2254 | No | ||
| 18 | PIK3CA | 6220129 | 12423 | -0.053 | 0.2066 | No | ||
| 19 | IL3RA | 6350468 | 15625 | -0.289 | 0.0711 | No | ||
| 20 | BAD | 2120148 | 17103 | -0.707 | 0.0814 | No |